Translating Biodiversity Data into Reports
Posted 29th October 2025
Introduction
Biodiversity, ecosystems and natural environments are complex systems. Vast interacting systems of nutrients, water and energy driving further complex relationships of microorganisms, fauna and flora that create resilient and robust ecosystems providing all the ecosystem services that allows for a continuing existence on earth. It is difficult to truly detail the complexity of an ecosystem in its entirety; as any imbalance in any one component on any scale may lead to unpredictable effects elsewhere within the ecosystem. Understanding ecosystems at any scale and in reference to any component within them can result in the life’s work of researchers, citizen scientists and indigenous communities around the world. When are we dealing with such extraordinarily complex systems that we do not always understand? How may we as designated experts transmit such knowledge to clients responsible for delivering environmentally sound projects while effectively communicating relevant data.
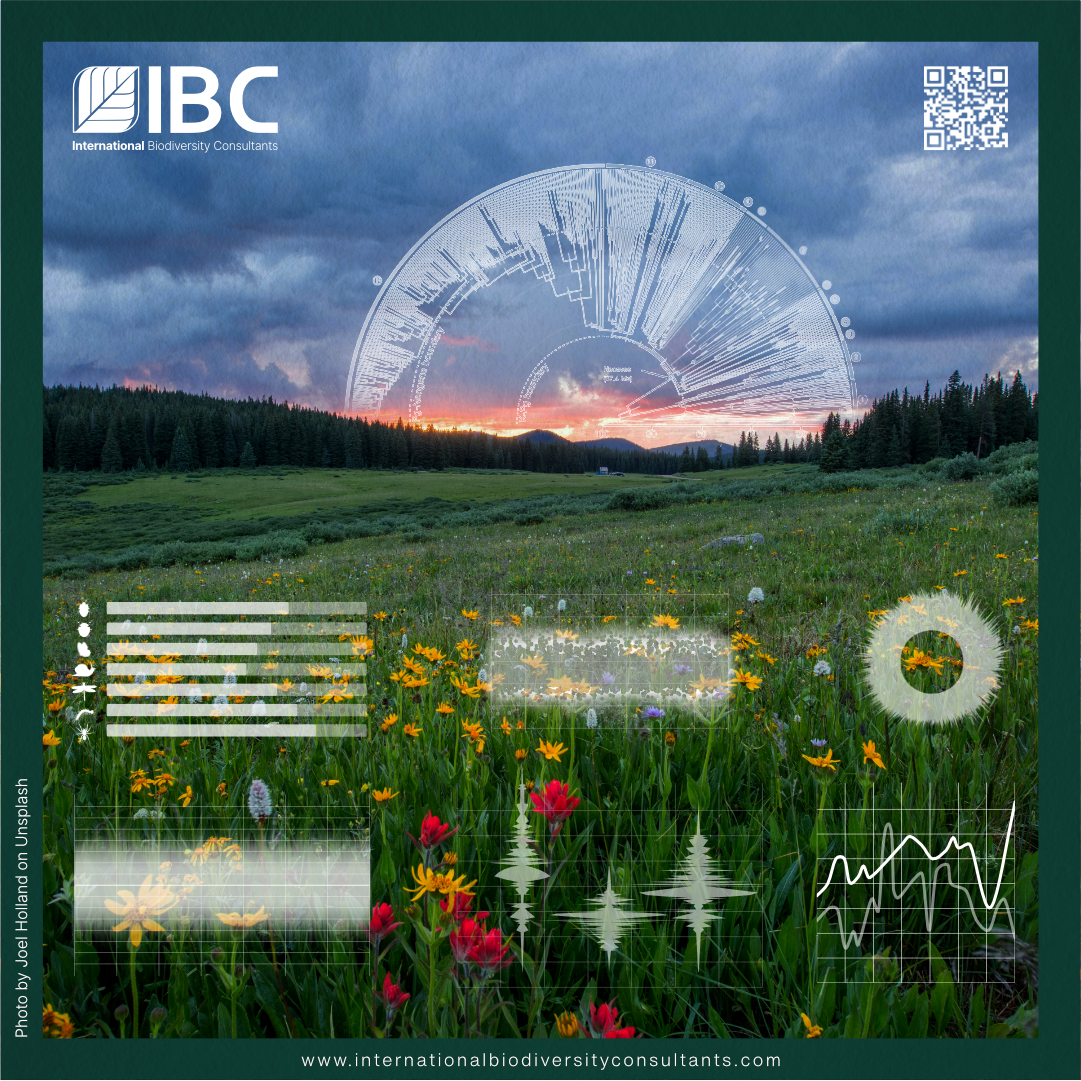
Figure 1. Nature and Data
What do you really want?
One way we can do this is by thinking about reports and our data empirically; and asking questions such as ‘Who is our client?’, ‘What do they want from this report?’, ‘What do we need to transmit?’. Even when working on groundbreaking and exciting projects; how much of the day get’s devoted to back-and-forth, unnecessarily long meetings and switching between projects/ideas and thought trains haphazardly. In a ‘performance-based’ work culture, our work revolves around how much of quality work we produce. This seems fair enough on face value, and a good metric to measure ourselves by. But what is often happening, as the author Cal Newport discusses, is that we are entering a world of incessantly appearing and feeling productive or being ‘busy’. It may resonate when we think about completing work over an 8-hour day, when that could have been done in two or three hours. What do we feel the remaining hours with, business meetings, emails and generating reports that painstakingly attempt to detail complex data. Yet, when trying to translate biodiversity data for clients do we create lengthy and tedious reports, knowing that clients and stakeholders will focus on the executive summary and perhaps a couple figures of interest? Inefficiencies in time management and productivity cost organisation time and money. An estimated 1.8 hours a day or 20% of the workweek can be lost to gathering and searching for information (1). A study by Forbes also found that employees on average spent 25 days a year going through the cognitive reorientation necessary when switching between app, device or data set (known as context switching) (2). Another estimate by McKinsey, estimated that 28 hours of was spent each week by knowledge workers, writing emails and engaging with internal communications (3). Extrapolating this data suggests an estimate that 41% of working time is lost to ‘shallow work’ equating to $1.3 trillion lost in wasted time (4). Imagine if we could dedicate that much resource back to protecting and restoring biodiversity. Knowing one’s client and the nature of their organisation recognises the role that organisational culture effects individuals time management. A government body often requires reams of paperwork, lengthy prose and detailed information so that it may hold up in public hearing and when under review. An NGO may prefer information that they too can use when pitching to stakeholders or potential funders. Research institutions will require well referenced and thoroughly explained reports. By knowing your audience, and what they need from a report can also reduce inefficiencies, lost time and money for all parties involved. Why write a lengthy report of >30 pages when we know that all the clients will read is the summaries and a key table or figure pertaining to what they need.
We have the solutions!
Today ecological restoration comes in the form of Nature-based Solutions (NbS), rewilding landscapes and greening our urban environments. Such themes lend themselves to more visually demanding forms of reports. But in a world overloaded with information, how can we punch through to deliver our critical points?
Graphics
Professionals now have the tools to produce 3D terrain model maps; we can Augment Reality (AR) or use Mixed Reality (MR) through Building Information Modelling (BIM) or use of Light Detection and Ranging (LiDAR) and we can lead clients through these worlds with Virtual Reality (VR) headsets to show future states of change (7). Digital Twins, the concept of producing a digital replica also extends to ecology with current studies focusing on how for example we can evaluate migratory bird patterns (8). Use of economical LiDAR can help us understand 3D structures and provide new insights into ecological processes (9). Technology such as drones, smart phones/tablets (10), open-source Geographical Information Software (GIS) (e.g., QGIS) and data collection apps (e.g., Mergin Maps) all assist with visual demonstrations.
Data
Ecological surveys today are now data-heavy with a multitude of devices collecting georeferenced data, imagery (drones, cameras, LiDAR), acoustic data (e.g., bat and bird calls, habitat sourced sounds). Real-time ecological monitoring also creates huge amounts of data that requires analysis. Dashboards are increasingly required to interpret what’s recorded and applications like Microsoft Power BI, Tableu, Looker (Google Cloud), FineReport and Bold Reports can be used to help support (11). Majority of these are aimed at enterprise use, but Looker Studio from Google is free to use.
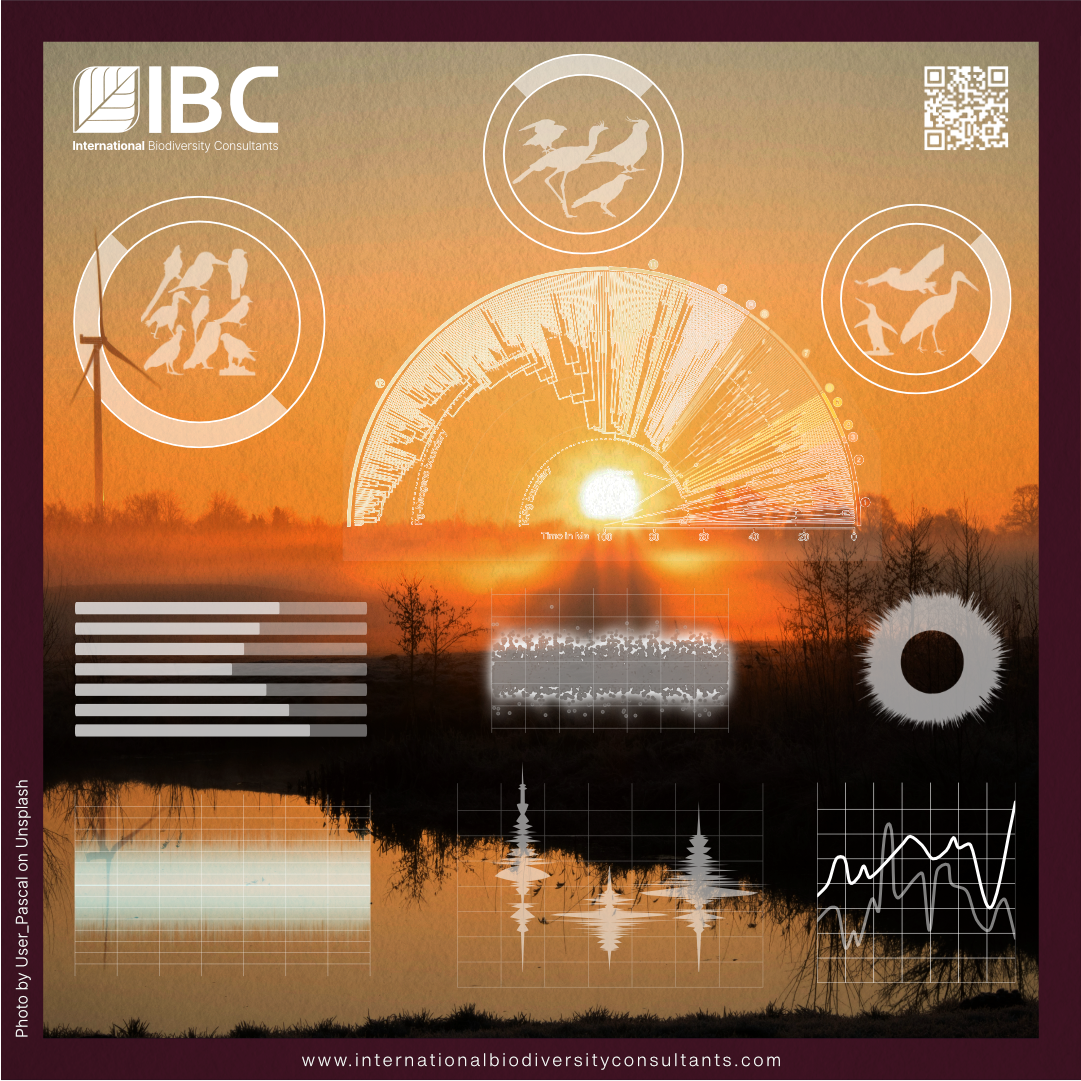
Figure 2. IBC has used digital dashboards to explain ecology data to its clients.
Final Delivery
For high-level, fast transmittal of information with a user-friendly graphical interface, Microsoft PowerPoint combines graphics and text seamlessly. Microsoft Word still remains the go-to application for word processing, but others might want to explore LaTeX Project (open-source) optimised for technical and scientific documentation.
Here some others to explore:
• Scribe – useful for creating visual, step-by-step guides for procedures (lab-based or fieldwork), can auto-generate documentation from screen recordings, annotate screenshots and instructions and easy to share and embed
• Document360 – for centralised knowledge bases and internal/external documentation (also project management)
• ClickHelp – multi-format publishing and structured documentation supporting conditional text, variables and content use making it ideal for consistency and modular documenting.
How can IBC help?
Digital technology is evolving quickly. So why ought we continue with the now old-fashioned text block report? Why not think of new, innovative and dynamic means of engaging audiences with biodiversity data? Perhaps this may even provide a new incentive for action? Global support for the digitisation of biodiversity data for enhancing monitoring, accessibility and decision-making has been verified. Integrating digital technologies with biodiversity also presents opportunities in enhancing global knowledge equality and representation; especially amongst indigenous communities. Enhancing the global capacity for biodiversity digitisation requires strong governance, innovation, digital literacy and ethics within benefit sharing, presenting opportunities for social and environmental development (5).
IBC can offer a new and unique style of reporting, tailored specifically to the needs of clients and to how they may wish to use that data. Rather than attempting to detail and synthesise complex data into a readable format for those that perhaps do not have a background in the science itself; thus, creating long documents explaining concepts and acronyms that may or may not ever be read. IBC offers a new way of presenting this data, in IBCs ‘eReport’ format. An ‘eReport’ can take many forms totally dependent on what the client needs. An Environmental Impact Assessment (EIA) may visually appear as a video, derived from baseline surveys that show potential impacts of developments, or conservation actions. A Social Impact Assessment may appear as an interactive chart, detailing how a project and development scenarios impacts key metrics. A biodiversity assessment may be presented as a digital ‘tour’ of a local ecosystem, with interactive elements that show key findings recorded from baseline surveys and inferences based upon this data.
The Biodiversity Futures programme identifies the opportunities in a new wave of digitalisation within the biodiversity sphere. This offers an opportunity to build capacity and enhance collaborative partnerships at all levels to connect biodiversity conservation with technology progress. The advancement of technology has often been built off, or or fuelled by the exploitation of biodiversity and natural resources. Why not then, can we utilise technology to now protect and restore it too?
Disclaimer
IBC has not received any support from third-party application providers discussed and linked in this article or has received any revenue from advertising such. Information is provided purely on an educational/knowledge-building basis.
References
1. Hamilton, D. PhD. Time Management At Work: Efficiency Should Be Rewarded, Not Punished. Forbes. [Online] Forbes, 07 04 2025. [Cited: 25 September 2025.] https://www.forbes.com/sites/dianehamilton/2025/04/07/time-management-at-work–efficiency-should-be-rewarded-not-punished/
2. Murty, R. Dadlani, S. Das, R. How Much Time and Energy Do We Waste Toggling Between Applications? HBR. [Online] 29 August 2022. [Cited: 27 September 2025.] https://hbr.org/2022/08/how-much-time-and-energy-do-we-waste-toggling-between-applications.
3. McKinsey Global Institute. The Social Econom: Unlocking alue and productivity through social technologies. 2012.
4. Newport, Cal. Deep Work. s.l. : Grand Central Publishing, 2016.
5. Organizational culture: A systematic review. Bogale, A. Debela, K. 1, s.l. : Cogent Buisnesss & Management, 2024, Vol. 11.
6. McKinsey & Company. The economic potential of generative AI. 2023.
7. Li Teng, Weng, Vive A sustainable shift: Integrating Green Computing into Virtual Reality. Accessed at: https://blog.vive.com/us/a-sustainable-shift-integrating-green-computing-into-virtual-reality/
8. Richardson, H. (2025) Digital flocks, predators allow ecologists to simulate real-world animal behaviour. Accessed at: https://www.nature.com/articles/d41586-025-03314-y
9. Maedam E.E. et al (2025) Expanding forest research with terrestrial LiDAR technology. Accessed at: https://www.nature.com/articles/s41467-025-63946-6
10. Tatsumi, S. et al. (2022) ForestScanner: A mobile application for measuring and mapping trees with LiDAR-equipped iPhone and iPad. Accessed at: https://besjournals.onlinelibrary.wiley.com/doi/full/10.1111/2041210X.13900
11. Best DevOps (2025) Top 10 Reporting Tools in 2025: Features, Pros, Cons & Comparisons. Accessed at: https://www.bestdevops.com/top-10-reporting-tools-tools-in-2025-features-pros-cons-comparison/